Did a $100,000 H-1B Visa Fee Sink North Texas Home Prices?
Home-purchase mortgages to Asian Indian borrowers in Collin County fell 43% from 2023 to 2025. The slide began before the $100,000 H-1B fee, and in 2025 it spread to all twelve counties studied.
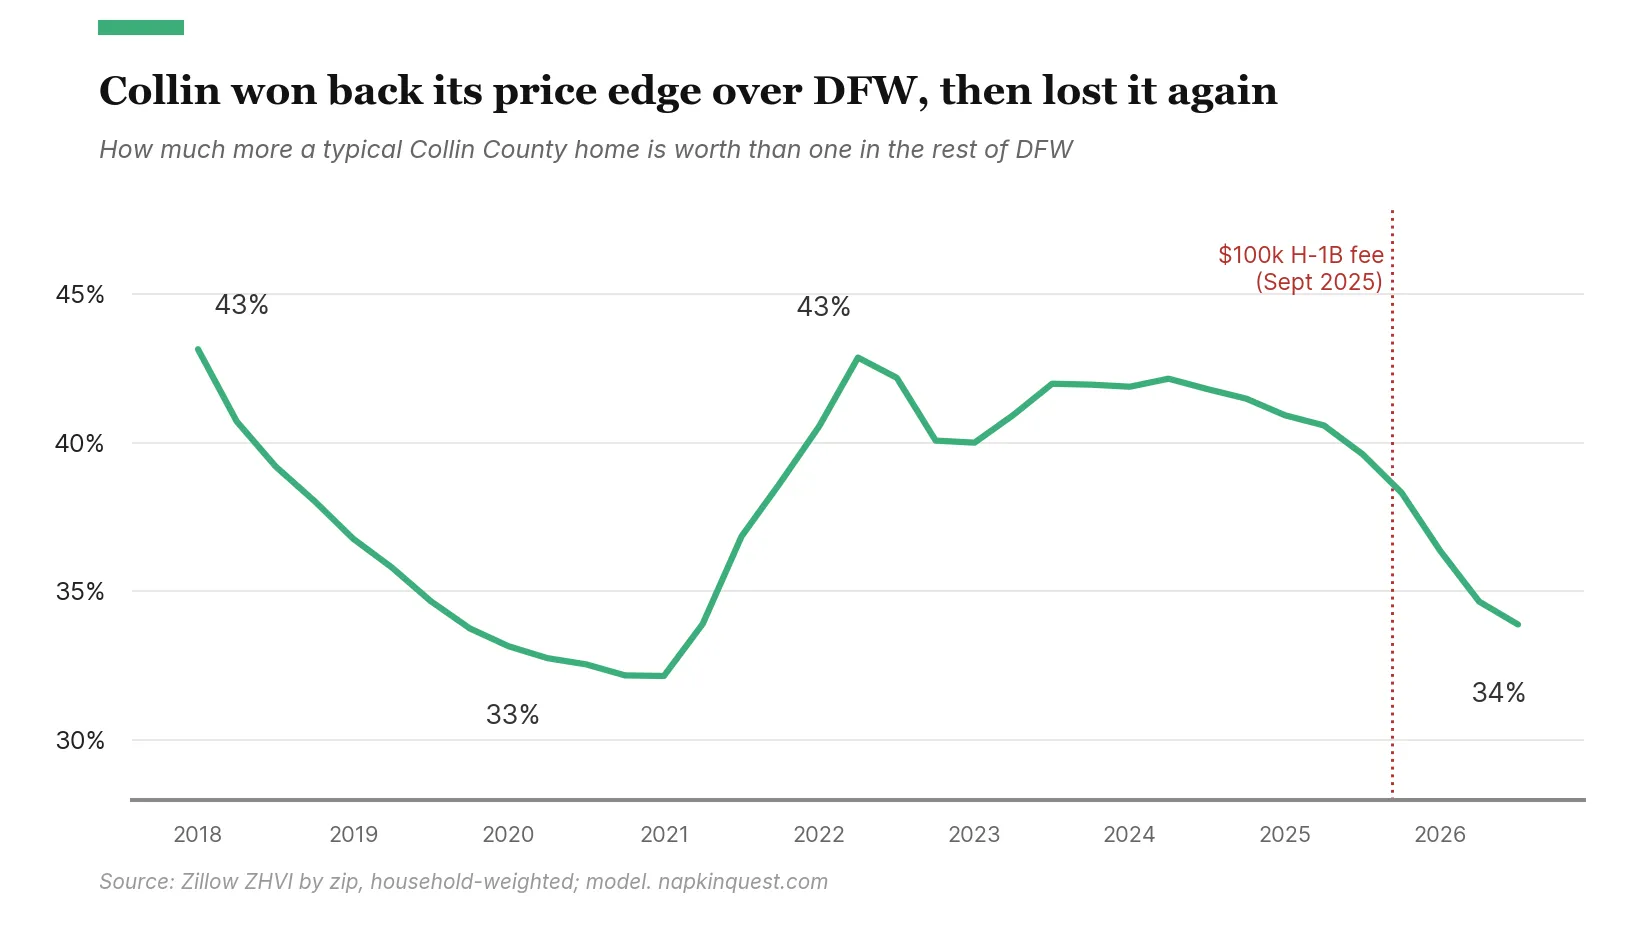
Home prices jumped everywhere in Dallas-Fort Worth during the pandemic. From early 2020 to mid-2022, typical home values in the metro outside Collin County rose 42%, and in Collin they rose 52%.1 That broad jump is what most locals have been living with, and it came from forces that hit the whole region: cheap mortgages, remote work and an influx of new residents. The narrower question is why Collin rose further than its neighbors and then gave it back. In 2018 a typical Collin home was worth 43% more than one in the rest of DFW. By 2020 that edge had slipped to 33%. By mid-2022 it was back to 43%, and by the third quarter of 2026 it was down to 34%.
The explanation making the rounds is the $100,000 fee on new H-1B petitions that took effect in September 2025.2 Collin has more India-born residents than any other county in Texas.3 Ted Wilson of Residential Strategies, a Dallas housing research firm, and at least one builder have told reporters that international and South Asian buyers, once the majority of some new-home sales, have thinned out.45 It is a tidy story, and half of it holds up. Mortgage data shows that Asian Indian borrowers took out sharply fewer home-purchase loans in Collin. But the pullback started in 2024, before the fee took effect. So did the fee matter at all?
Most of the percentages below are changes over time. The ones that carry the argument are also comparisons, Collin against the rest of DFW or one group of buyers against everyone else, which strips out forces like mortgage rates that hit the whole region at once.
- Collin’s price edge is the typical Collin home value divided by the typical value in the rest of the Dallas-Fort Worth metro, minus one. The values come from Zillow’s zip-code index, averaged across zip codes by number of households.1 A swing that moves the whole metro moves both halves and leaves the edge where it was.
- Asian Indian purchases are mortgages taken out to buy a primary residence where the borrower or a co-borrower identifies as Asian Indian, from federal Home Mortgage Disclosure Act data.6 They leave out cash purchases, and they say nothing about citizenship or visa status. “Everyone else” means every other mortgage-financed purchase of a primary residence in the same county and year. Percentage changes in purchases are changes in the number of these loans between two years.
- A zip code’s price path is its own trend in home values from 2023 to mid-2025, extended forward. Falling below it means prices did worse than that zip code’s recent trend would predict.
- County comparisons run the same mortgage counts for twelve counties with large India-born populations, picked by hand as a mix of Sun Belt growth areas and coastal tech hubs. They are not every such county. Each county’s change is measured against its own earlier count. The twelve are:
- North DFW: Collin and Denton
- Elsewhere in the Sun Belt: Williamson and Travis (Austin), Fort Bend (Houston), Wake (Raleigh), Forsyth (Atlanta) and Maricopa (Phoenix)
- Coastal tech hubs: Santa Clara and Alameda (San Francisco Bay Area), King (Seattle) and Middlesex (central New Jersey)
Here are Collin County purchase mortgages by year:
| Collin purchase mortgages | 2018 | 2020 | 2021 | 2022 | 2023 | 2024 | 2025 |
|---|---|---|---|---|---|---|---|
| Asian Indian borrowers | 1,246 | 1,642 | 2,559 | 3,819 | 4,481 | 3,989 | 2,538 |
| Everyone else | 16,697 | 20,693 | 18,773 | 15,181 | 13,709 | 14,520 | 15,096 |
| Asian Indian share of purchases | 7% | 7% | 12% | 20% | 25% | 22% | 14% |
From 2020 to 2023, average mortgage rates more than doubled,7 and everyone else cut their Collin purchases by a third. Over the same three years Asian Indian borrowers nearly tripled theirs. Had Asian Indian purchases stayed at their 2020 level, total Collin purchases would have fallen 31% from 2020 to 2023. Instead they fell 19%, so that one group offset about 41% of the decline. Denton County, just west, shows the same pattern, with Asian Indian purchases up 266% from 2020 to 2023. If the same forces had lifted every buyer, everyone else would have bought more too. They bought a third less.
Then it reversed. Asian Indian purchases in Collin fell 11% in 2024 and 36% in 2025, while everyone else bought slightly more.
Collin’s price edge came back in 2021 and 2022, the two years Asian Indian purchases grew by about half each year. It held while their buying peaked and shrank as their purchases fell. The extra buyers above the 2020 level made up about 4% of Collin purchases in 2021 and 16% by 2023, and a shift in demand that size can raise prices before builders finish new homes. Inside DFW the pattern repeats at the zip-code level: after mid-2025, zip codes with more India-born residents fell further below their price path than zip codes with fewer, though India-born share closely tracks the share of residents in tech jobs, so that comparison can’t separate the two.
The match breaks down before the pandemic, though. From 2018 to 2020, Asian Indian purchases in Collin rose 32%, yet Collin’s edge fell 10 percentage points (from 43% to 33%). Whatever was pulling Collin down relative to the rest of DFW in those years, more Asian Indian buyers did not offset it. So other forces can move Collin’s edge too. From 2021 on, this group of buyers is the clearest one.
The H-1B fee applies to new petitions for workers coming from abroad. People already in the US who change status, switch employers or renew are exempt.2 Back of the napkin, the Dallas area sees about 8,000 new H-1B approvals a year.4 About 46% of new approvals nationally are for workers abroad.8 Collin holds about 44% of the metro’s India-born residents.3 That comes to roughly 1,600 fee-exposed arrivals a year headed for Collin. If 70% of them stopped coming and 30% of those would have bought a home within a year or two, that is about 340 lost purchases a year, or 2% of the 16,437 single-family homes that sold in Collin in 2025.9 That is a real loss, but Asian Indian purchases in Collin fell by about 1,950 from 2023 to 2025, nearly six times as many. And about 500 of that drop came in 2024, before the fee existed.
Maybe the fee was a signal, and employers pulled back on visa workers before it took effect. If they did, it should show up in the paperwork. Before an employer can file an H-1B petition, it has to file a labor condition application with the Labor Department, and those filings are public.10 The worker positions on DFW filings rose 20% from 2024 to 2025, and positions in the categories the fee exempted (renewals, job changes and amendments) rose 27%. In the first half of 2026, total positions were still up 9% from a year earlier. Fee-exempt positions were down about 10% from the first half of 2025 but still 34% above the first half of 2024, and positions at staffing-heavy employers were down 11%. Nationally, H-1B lottery registrations fell 38% for fiscal 2027, from 343,981 to 211,600, but that was the first lottery under both the fee and a new wage-weighted selection system, so the fee’s share of that drop is unclear.11
The fee’s legal standing has also been unsettled. A federal district court in Washington, D.C., upheld it in December 2025, a ruling now on appeal.12 A federal judge in Massachusetts vacated it in June 2026, and the First Circuit declined to pause that ruling, so collection stopped.13 In September 2026 a new proclamation extended the fee through September 2027, though collection remains blocked while the litigation continues,14 and on September 30 a federal judge in California blocked the agency guidance used to carry it out.15 DHS has also proposed a separate $103,265 fee on petitions subject to the annual lottery.16
Across all twelve counties listed above, Asian Indian purchases fell between 15% and 40% from 2024 to 2025. Purchases by everyone else ranged from down 5% to up 12%. The drop shows up even in Santa Clara, Alameda, King and Middlesex counties, the coastal tech hubs where these buyers never surged, and it is steepest where the surge had been biggest: 40% in Williamson County outside Austin, 38% in Denton and 36% in Collin. Something in 2025 hit this group of buyers, and it hit them in all twelve counties. That is a change from 2024, when the decline was confined to the Sun Belt counties where the surge had been.
Was it the fee? The mortgage data is annual, so it can’t say when in 2025 the drop happened, but it can put a ceiling on the fee. The fee was in effect for the last 102 days of 2025, about 28% of the year. Even if Asian Indian purchases had stopped completely on September 21 and closings were spread evenly through the year, the fee could account for at most a 28% annual drop. Collin, Denton and Williamson all fell further than that, so in those counties part of the 2025 drop came before the fee took effect. In the other nine counties, where drops ranged from 15% to just under 28%, this arithmetic can’t rule the fee in or out. The ceiling is also generous to the fee, since closings usually trail contracts by a month or more.
A drop that hits one group of buyers in every county at once, while everyone else keeps buying, points to something specific to that group, not to the housing market. The main alternative in news coverage is tech layoffs and companies cutting staff in favor of AI,45 but that doesn’t show up in DFW’s 2025 job numbers: private tech employment across Collin, Dallas and Denton counties grew slightly in every quarter of 2025.17 Rates don’t explain it either: the average 30-year mortgage rate was flat in 2025,7 and other buyers held steady. Nor does a broader chill on immigrant buyers, since Hispanic borrowers in the twelve counties bought slightly more in 2025. The drop tracked H-1B exposure instead. Asian Indian purchases across the twelve counties fell 28% and Chinese purchases 13%,6 and India-born and China-born workers received 71% and about 12% of H-1B approvals in fiscal 2024.8 That points to the tightening of H-1B policy during 2025, of which the fee was one part.
Collin’s exurbs were also permitting new homes at an unusual pace. From 2023 through 2025, Celina permitted new single-family homes equal to 70% of its existing housing stock. Princeton permitted 53%, Melissa 37% and Anna 34%.18 Across DFW, zip codes in the cities that permitted the most fell further below their price path after mid-2025. Permits turn into finished homes a year or two later, so many were still arriving as the buyer pool shrank, and Princeton, Celina and Anna posted three of the four steepest price drops in the county. Princeton fell about 10% in a year.1
The county comparison shows where the surge happened.
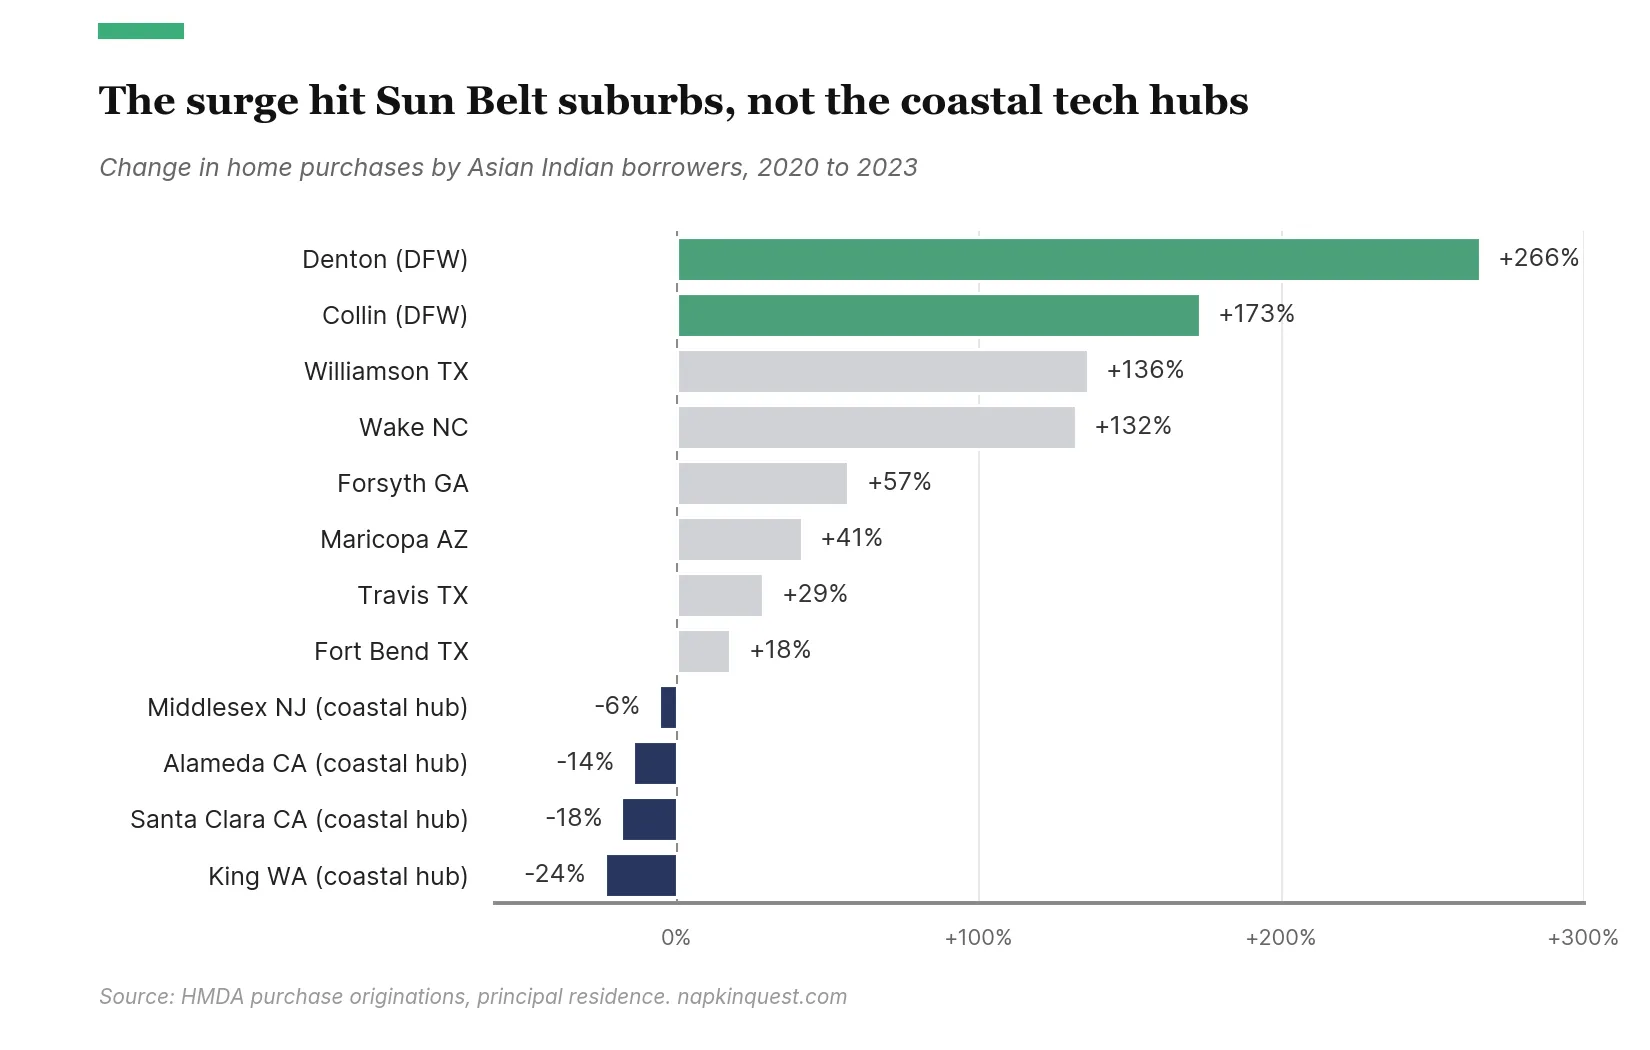
The surge is concentrated in fast-growing Sun Belt counties near tech jobs, while purchases in the expensive coastal hubs fell. Asian Indian borrowers’ share of all purchase loans rose in all twelve counties, coastal ones included, because they kept buying while others pulled back. The big increases came in places like north DFW.
The first potential driver is a one-time burst of green cards. During the pandemic, unused family-based visa numbers rolled over into employment-based categories, and the employment-based limit for fiscal 2022 was 281,507, roughly double the normal level.19 India-born employment-based green cards went from about 25,000 in fiscal 2020 to 75,332 in 2021 and 96,335 in 2022, more than a third of the fiscal 2022 total.20 Then the State Department pushed back the EB-2 India cutoff date in October 2022 and the EB-3 India date in July 2023,21 and India-born employment-based green cards fell to 28,570 in fiscal 2023 and 18,800 in 2024.20 Collin’s Asian Indian purchases peaked about a year after the green cards did.
The timing fits, but the size doesn’t. The extra green cards in fiscal 2021 and 2022 came to about 128,000 people nationally, spouses and children included. Collin and Denton hold 3.85% of the country’s India-born residents, so a proportional share would be about 4,900 people.3 Yet the two counties added about 11,200 Asian Indian purchases above their 2020 level from 2021 to 2023. Even if every one of those 4,900 people had bought a home alone, that is more than twice as many purchases as people. Put without the proportional assumption, the surge would have needed about 9% of every extra green-card recipient in the country to buy in these two counties. So green cards explain part of the surge at most. Two other potential drivers fit the county pattern: H-1B holders buying before they had green cards, and households moving from pricier metros once remote work allowed it. The mortgage data doesn’t record visa status or where buyers came from, so it can’t size either one. Corporate relocations are a fourth potential driver: Bloomberg reports that DFW drew more corporate headquarters moves than anywhere else in the US from 2018 on.4 Relocations from a headquarters move can trail it by years, so those moves could have fed the surge. Asian Indian purchases in Collin rose 12% in 2019 and 18% in 2020, which fits that kind of steady trail. Then they jumped 56% in 2021, which suggests something else added to it that year, such as the green-card wave or remote work.
The 2024 start looks local. From 2023 to 2024, Asian Indian purchases fell 2% to 19% in the Sun Belt surge counties (Collin, Denton, Williamson, Wake and Travis) but rose 9% to 25% in the four coastal hubs. A national cause, such as the green-card collapse, would have hit the coasts too. That looks like the surge running out of buyers in the places it had been concentrated. Private tech employment across Collin, Dallas and Denton counties was also down 1% to 3% from a year earlier in each of the first three quarters of 2024, before growing slightly through 2025 and falling again in early 2026.17 That local dip may have contributed.
Half of it is. The H-1B story is right about who stopped buying, and right that 2025 is when it turned sharp. Asian Indian borrowers were a quarter of Collin’s mortgage buyers in 2023 and 14% in 2025, and in 2025 their purchases fell in all twelve counties we checked while everyone else’s held steady. Whatever hit them that year hit them well beyond Collin, and it hit buyers in proportion to their exposure to H-1B visas, which points to tighter H-1B policy.
The fee is the weak link. Collin’s slide started in 2024, a year before the fee, and only in the Sun Belt counties where the buying surge had been, which looks like that surge running out. The fee is too small to explain the drop, employers kept filing for H-1B workers through 2025, and part of Collin’s 2025 drop came before September. Meanwhile the exurbs kept adding new homes, so when this group of buyers thinned out, Collin’s price edge shrank.
Why so many of these buyers arrived from 2021 to 2023 is the part the data settles least. Coastal tech hubs lost these buyers while Sun Belt suburbs gained them, which points to households moving south. Headquarters relocations, remote work, the green-card wave and H-1B holders buying before green cards could all have contributed, though the green-card wave is too small to have been the main one.
- Cash buyers. If Asian Indian buyers shifted toward cash, the drop is smaller than it looks.
- Visa status. Because “Asian Indian” includes citizens and long-time residents, the data can’t show how many of the missing buyers would have been on visas.
- Timing within 2025. Monthly county deed records would show whether the 2025 drop came before or after September 21, which would separate the fee from the rest of 2025. The 28% ceiling above assumes closings are spread evenly through the year.
- The price data is short and smoothed. Zillow’s index averages over months and records sales at closing, so part of the price decline after the fee reflects purchase decisions made earlier. If courts let collection resume and Collin’s most exposed zip codes fell further, that would point back toward the fee.
-
Zillow. Home Value Index (ZHVI) by zip code, middle tier, smoothed and seasonally adjusted. https://www.zillow.com/research/data/ (zips weighted by ACS households; Collin County vs the rest of the Dallas-Fort Worth-Arlington metro; Princeton 75407, third quarter 2025 to third quarter 2026). ↩ ↩2 ↩3
-
USCIS. “H-1B Specialty Occupations: Frequently Asked Questions on the September 19, 2025 Proclamation.” https://www.uscis.gov/newsroom/alerts/h-1b-faq ↩ ↩2
-
US Census Bureau, American Community Survey 2020-2024 5-year estimates, table B05006 (place of birth for the foreign-born population), via Census Reporter. Collin 79,154 and Denton 32,095 India-born residents; Dallas-Fort Worth-Arlington MSA 181,474; United States 2,889,077. Texas county ranking (Collin first, Dallas second at 50,682): https://censusreporter.org/data/table/?table=B05006&geo_ids=050|04000US48; county and metro figures: https://censusreporter.org/data/table/?table=B05006&geo_ids=05000US48085,05000US48121,31000US19100,01000US ↩ ↩2 ↩3
-
Bloomberg, via American Bazaar. “How H-1B visa challenges are reshaping Dallas’ once-booming housing market.” June 4, 2026. https://americanbazaaronline.com/2026/06/04/how-h-1b-visa-challenges-are-reshaping-dallas-once-booming-housing-market-482204/ (about 32,000 new Dallas-area H-1B approvals over the four fiscal years to September 2024; a builder’s South Asian buyer share falling from about 70% to under 30%; DFW leading the US in corporate headquarters relocations from 2018 on; tech layoffs and AI-driven job cuts cited as causes). Approval count also via Yahoo Finance: https://finance.yahoo.com/economy/policy/articles/president-trump-crackdown-h1b-visa-160937711.html ↩ ↩2 ↩3 ↩4
-
HousingWire. “Court ruling sparks questions on fading H-1B buyer demand.” June 16, 2026. https://www.housingwire.com/articles/court-ruling-spark-fading-h-1b-buyer-demand/ (Ted Wilson of Residential Strategies on Celina’s international buyer share). ↩ ↩2
-
Federal Financial Institutions Examination Council. HMDA Data Browser, 2018-2025 loan-level data. https://ffiec.cfpb.gov/data-browser/ (home-purchase originations for principal residences; Asian Indian is race code 21 for any applicant or co-applicant; loans purchased by the reporting institution excluded). ↩ ↩2
-
Freddie Mac. Primary Mortgage Market Survey, 30-year fixed rate. https://www.freddiemac.com/pmms (annual averages of the weekly series: 3.11% in 2020, 6.81% in 2023, 6.72% in 2024 and 6.60% in 2025, computed from FRED series MORTGAGE30US: https://fred.stlouisfed.org/series/MORTGAGE30US). ↩ ↩2
-
USCIS. “Characteristics of H-1B Specialty Occupation Workers, Fiscal Year 2024.” https://www.uscis.gov/sites/default/files/document/reports/ola_signed_h1b_characteristics_congressional_report_FY24.pdf (46% of initial-employment approvals requested consular notification; 71% of all approved petitions were for India-born beneficiaries and about 12% for China-born, section 2.3). ↩ ↩2
-
North Texas Real Estate Information Systems / Texas Real Estate Research Center. Monthly MLS summary reports, January-December 2025, e.g. https://www.mymetrotex.com/wp-content/uploads/2026/01/NTREIS-Monthly-MLS-Summary-Report-202512.pdf (Collin single-family closed sales summed across 2025). ↩
-
US Department of Labor, Office of Foreign Labor Certification. LCA Programs disclosure data, FY2024 Q1 to FY2026 Q3. https://www.dol.gov/agencies/eta/foreign-labor/performance (H-1B worker positions at DFW-county worksites, by case type and decision quarter; staffing-heavy means employers DOL flags as H-1B dependent). ↩
-
Mintz. “USCIS Announces FY2027 H-1B Cap Reached; No Second Lottery.” July 20, 2026. https://www.mintz.com/insights-center/viewpoints/2806/2026-07-20-uscis-announces-fy2027-h-1b-cap-reached-no-second (211,600 properly submitted registrations for FY2027 vs 343,981 eligible registrations for FY2026; first season under weighted selection). ↩
-
Chamber of Commerce v. U.S. Department of Homeland Security, No. 1:25-cv-03675 (D.D.C. Dec. 23, 2025), summarized by Envoy Global, “U.S. District Court Upholds $100,000 H-1B Fee.” https://www.envoyglobal.com/news-alert/u-s-district-court-upholds-100000-h-1b-fee ↩
-
Fragomen. “United States: Federal Appeals Court Declines to Stay Lower Court Order Vacating $100,000 H-1B Fee.” 2026. https://www.fragomen.com/insights/united-states-federal-appeals-court-declines-to-stay-lower-court-order-vacating-dollar100000-h-1b-fee.html; Barnes & Thornburg. “First Circuit Denies Government’s Request to Stay Decision Striking Down $100,000 H-1B Fee.” 2026. https://btlaw.com/en/insights/alerts/2026/first-circuit-denies-governments-request-to-stay-decision-striking-down-100000-h1b-fee ↩
-
Mintz. “Presidential Proclamation Extends $100K H-1B Fee.” September 23, 2026. https://www.mintz.com/insights-center/viewpoints/2806/2026-09-23-presidential-proclamation-extends-100k-h-1b-fee; Yale Office of International Students and Scholars. “Presidential Proclamation Extends H-1B $100,000 Fee Policy; Fee Remains Blocked by Court Order.” https://oiss.yale.edu/news/presidential-proclamation-extends-h-1b-100000-fee-policy-fee-remains-blocked-by-court-order ↩
-
Global Nurse Force v. Trump (N.D. Cal. Sept. 30, 2026), preliminary injunction by Judge Haywood S. Gilliam Jr. Case page: https://clearinghouse.net/case/47032/; summary: https://www.visalawyerblog.com/federal-judge-blocks-100000-h-1b-fee/ ↩
-
Cozen O’Connor. “DHS Proposes New $103,265 Fee for Cap-Subject H-1B Petitions.” 2026. https://www.cozen.com/news-resources/publications/2026/dhs-proposes-new-103-265-fee-for-cap-subject-h-1b-petitions (proposed rule published August 25, 2026). ↩
-
US Bureau of Labor Statistics. Quarterly Census of Employment and Wages, 2023Q1 to 2026Q1. https://www.bls.gov/cew/ (private employment in NAICS 5415, 518 and 5132, Collin, Dallas and Denton counties combined; combined because BLS reassigned about 6,000 jobs at existing employers from Collin to Dallas and Denton in early 2025). ↩ ↩2
-
US Census Bureau. Building Permits Survey, place-level annual files, 2023-2025. https://www2.census.gov/econ/bps/Place/South%20Region/ (1-unit permits divided by each city’s 2020-2024 ACS housing units). ↩
-
USCIS. “Fiscal Year 2023 Employment-Based Adjustment of Status FAQs.” https://www.uscis.gov/green-card/green-card-processes-and-procedures/fiscal-year-2023-employment-based-adjustment-of-status-faqs (FY2022 employment-based limit of 281,507, from unused FY2021 family-based numbers). ↩
-
US Department of Homeland Security, Office of Homeland Security Statistics. Yearbook of Immigration Statistics, Table 10, “Persons Obtaining Lawful Permanent Resident Status by Broad Class of Admission and Region and Country of Birth,” fiscal years 2018-2024 (India, employment-based preferences, including dependents and both new arrivals and adjustments of status; FY2023 and FY2024 rounded to the nearest 10 in the source). https://ohss.dhs.gov/topics/immigration/yearbook/2020/table10, https://ohss.dhs.gov/topics/immigration/yearbook/2021/table10, https://ohss.dhs.gov/topics/immigration/yearbook/2022/table10, https://ohss.dhs.gov/topics/immigration/yearbook/2023/table10, https://ohss.dhs.gov/topics/immigration/yearbook/2024/table10. Fiscal 2022 employment-based total of 270,284 from Table 6: https://ohss.dhs.gov/topics/immigration/yearbook/2022/table6 ↩ ↩2
-
US Department of State Visa Bulletins for October 2022 and July 2023, as summarized by EY, “US October 2022 Visa Bulletin reflects substantial retrogression in the employment-based second preference category for Indian-born green card applicants,” September 2022, https://globaltaxnews.ey.com/news/2022-5881-us-october-2022-visa-bulletin-reflects-substantial-retrogression-in-the-employment-based-second-preference-category-for-indian-born-green-card-applicants (EB-2 India final action date moved from December 1, 2014 to April 1, 2012), and Hunton Andrews Kurth, “July 2023 Visa Bulletin: EB-3 and EB-3 Other Workers India Retrogress More Than 3 Years,” June 2023, https://www.hunton.com/business-immigration-insights/july-2023-visa-bulletin-eb-3-and-eb-3-other-workers-india-retrogress-more-than-3-years-eb-3-all-other-countries-retreats-4-months (EB-3 India moved from June 15, 2012 to January 1, 2009). ↩